Data Frames | Pandas | Intro 1
Categories: CSP Big Idea 2Data connections, trends, and correlation. Pandas is introduced as it could be valuable for CPT and PBL.
- Files To Get
- Pandas and DataFrames
- Cleaning Data
- Extracting Info
- Create your own DataFrame
- Example of larger data set
- APIs are a Source for Panda Data
Files To Get
-
Use wget or drag-and-drop the _notebooks/CSP/big-ideas/big-idea-2 folder for this and other ipynb on pandas.
-
Use wget or drag-and-drop, in a subfolder named data in your _notebookx to grab data files.
- data.csv
- grade.json
- Use wget or drag-and-drop, then copy image file and place into subfolder named data_structures in your images folder. Grab the entire folder.
Pandas and DataFrames
In this lesson we will be exploring data analysis using Pandas.
- College Board talks about ideas like
- Tools. “the ability to process data depends on users capabilities and their tools”
- Combining Data. “combine county data sets”
- Status on Data”determining the artist with the greatest attendance during a particular month”
- Data poses challenge. “the need to clean data”, “incomplete data”
-
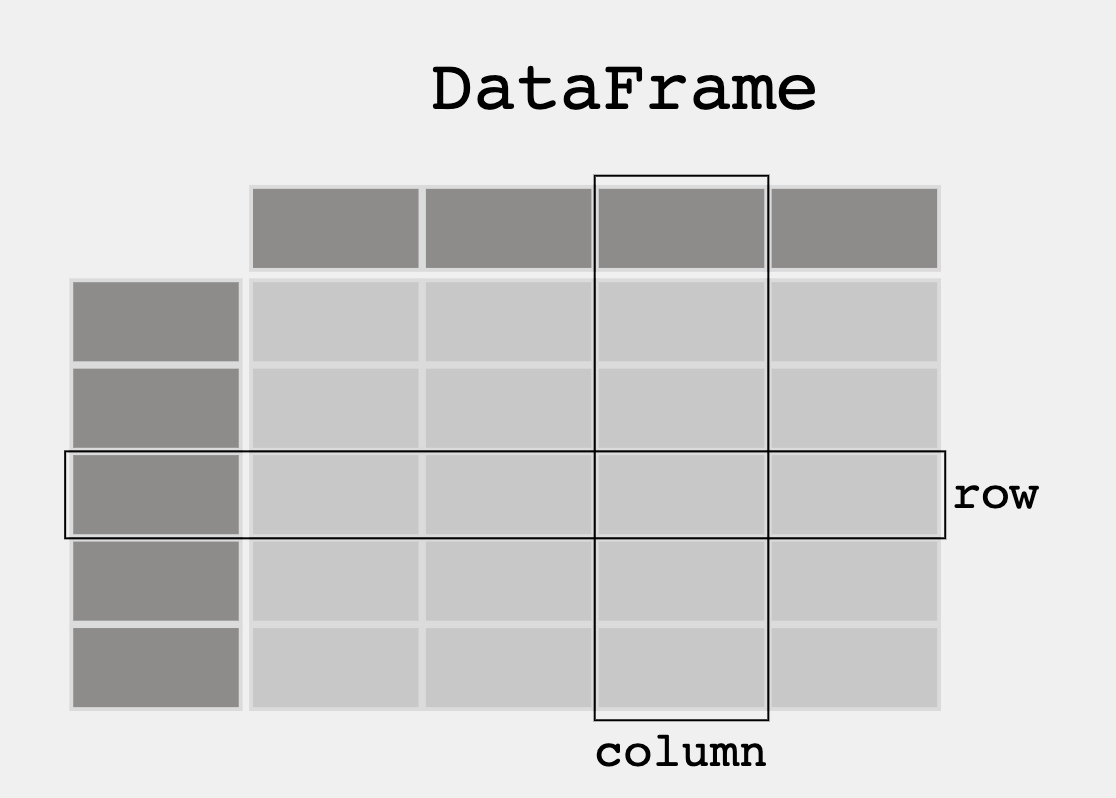
From Pandas Overview – When working with tabular data, such as data stored in spreadsheets or databases, pandas is the right tool for you. pandas will help you to explore, clean, and process your data. In pandas, a data table is called a DataFrame.
- DataFrame is a 2-dimensional labeled data structure with columns of potentially different types. It is similar to:
- a spreadsheet
- an SQL table
- a JSON object with rows [] with nexted key-values {}
# uncomment the following line to install the pandas library
# !pip install pandas

'''Pandas is used to gather data sets through its DataFrames implementation'''
import pandas as pd
Cleaning Data
When looking at a data set, check to see what data needs to be cleaned. Examples include:
- Missing Data Points
- Invalid Data
- Inaccurate Data
Run the following code to see what needs to be cleaned
# Read the JSON file and convert it to a Pandas DataFrame
# pd.read_json:  a method that reads a JSON and converts it to a DataFrame (df)
# df: a variable that holds the DataFrame
df = pd.read_json('data/grade.json')

# Print the DataFrame
print(df)

# Additional print statements to understand the DataFrame:
# print(df.info()) # prints a summary of the DataFrame, simmilar to database schema
# print(df.describe()) # prints statistics of the DataFrame
# print(df.head()) # prints the first 5 rows of the DataFrame
# print(df.tail()) # prints the last 5 rows of the DataFrame
# print(df.columns) # prints the columns of the DataFrame
# print(df.index) # prints the index of the DataFrame

# Questions:
# What part of the data set needs to be cleaned?
# From PBL learning, what is a good time to clean data?
# Could you hav Garbage in, Garbage out problem if you don't clean the data?
Extracting Info
Take a look at some features that the Pandas library has that extracts info from the dataset
DataFrame Extract Column
#print the values in the points column with column header
print(df[['GPA']])

print()

#try two columns and remove the index from print statement
print(df[['Student ID','GPA']].to_string(index=False))
DataFrame Sort
#sort values
print(df.sort_values(by=['GPA']))

print()

#sort the values in reverse order
print(df.sort_values(by=['GPA'], ascending=False))
DataFrame Selection or Filter
#print only values with a specific criteria
print(df[df.GPA > 3.00])
DataFrame Selection Max and Min
print(df[df.GPA == df.GPA.max()])
print()
print(df[df.GPA == df.GPA.min()])
Create your own DataFrame
Using Pandas allows you to create your own DataFrame in Python.
Python Dictionary to Pandas DataFrame
import pandas as pd

#the data can be stored as a python dictionary
dict = {
  "calories": [420, 380, 390],
  "duration": [50, 40, 45]
}
print("-------------Dictionary------------------")
print(dict)

#stores the data in a data frame
print("-------------Dict_to_DF------------------")
df = pd.DataFrame(dict)
print(df)

print("----------Dict_to_DF_labels--------------")
#or with the index argument, you can label rows.
df = pd.DataFrame(dict, index = ["day1", "day2", "day3"])
print(df)
Examine DataFrame Rows
print("-------Examine Selected Rows---------")
#use a list for multiple labels:
print(df.loc[["day1", "day3"]])

#refer to the row index:
print("--------Examine Single Row-----------")
print(df.loc["day1"])
Pandas DataFrame Information
#print info about the data set
print(df.info())
Example of larger data set
Pandas can read CSV and many other types of files, run the following code to see more features with a larger data set
import pandas as pd

#read csv and sort 'Duration' largest to smallest
df = pd.read_csv('data/data.csv').sort_values(by=['Duration'], ascending=False)

print("--Duration Top 10---------")
print(df.head(10))

print("--Duration Bottom 10------")
print(df.tail(10))
APIs are a Source for Panda Data
3rd Party APIs are a great source for creating Pandas Data Frames.
- Data can be fetched and resulting json can be placed into a Data Frame
- Observe output, this looks very similar to a Database
import pandas as pd
import requests

def fetch():
    '''Obtain data from an endpoint'''
    url = "https://devops.nighthawkcodingsociety.com/api/users/"
    fetch = requests.get(url)
    json = fetch.json()

    # filter data for requirement
    df = pd.DataFrame(json)

    # Check if 'active_classes' column exists in the DataFrame
    if 'active_classes' in df.columns:
        # Split the 'active_classes' strings into lists of class names and expand the lists into separate rows
        classes_series = df['active_classes'].str.split(',').explode()

        # Count the unique class names and print the counts
        print(classes_series.str.strip().value_counts())
    else:
        print("Column 'active_classes' does not exist in the DataFrame")

fetch()
import pandas as pd
import requests

def fetch():
    '''Obtain data from an endpoint'''
    url = "https://devops.nighthawkcodingsociety.com/api/users/"
    fetch = requests.get(url)
    json = fetch.json()

    # filter data for requirement
    df = pd.DataFrame(json)

    # Check if 'active_classes' column exists in the DataFrame
    if 'active_classes' in df.columns:
        # Split the 'active_classes' strings into lists of class names
        df['active_classes'] = df['active_classes'].str.split(',')

        # Get a list of unique class names by using a set comprehension
        unique_classes = pd.Series([unique_class.strip() for class_list in df['active_classes'] for unique_class in class_list]).unique()

        # Iterate over the each class name
        for current_class in unique_classes:
            # Filter the DataFrame for students in the current class using a lambda function
            class_df = df[df['active_classes'].apply(lambda classes: current_class in classes)]

            # Select the desired data frame column
            students = class_df[['active_classes','id', 'first_name', 'last_name']]

            # Print the list of students in the current class
            print(students.sort_values(by='last_name').head()) # avoids jupyter notebook truncation, remove .head() to print all students
            print()
    else:
        print("Column 'active_classes' does not exist in the DataFrame")

fetch()
Popcorn Hacks
Portfolio Building
- Add this Blog and other blogs to you own Blogging site.
- Have all lecture files saved to your files directory before Tech Talk starts.
- Add this Blog to you own Blogging site. In the Blog add notes and observations on each code cell.
The next 6 weeks, the Teachers want you to improve your understanding of data structures and data science. Your intention is to find some things to differentiate your individual College Board project, particularly if your project looks like all other projects.
- Look at this blog and others on data structures for todays date.
- Create or Find your own dataset. The suggestion is to use a JSON file, integrating with your CPT/PBL project would be Amazing.
- Build frontend to backend to filter or use your data set in your CPT/PBL.
- When choosing a data set, think about the following…
- Does it have a good sample size?
- Is there bias in the data?
- Does the data set need to be cleaned?
- What is the purpose of the data set?
- …